MOVING AVERAGES IN TRADING
BASIC STRATEGIES SUCH AS THE CROSSING OF MOVING AVERAGES IN TRADING
Introduction
Trading in financial markets requires the use of various strategies to identify potential opportunities and make informed decisions. One of the basic strategies used by traders is the crossing of moving averages. This technique helps to identify trends and potential entry or exit points in the market.
Understanding Moving Averages
Moving averages are commonly used technical indicators that help smooth out price data over a specified period. They provide a clearer picture of the underlying trend by eliminating short-term fluctuations. Traders often use two moving averages, a shorter-term one and a longer-term one, to identify potential trading opportunities.
Types of Moving Averages
There are different types of moving averages, including simple moving averages (SMA) and exponential moving averages (EMA). SMA gives equal weightage to all data points, while EMA puts more weight on recent data points. Traders choose the type of moving average that best suits their trading style and objectives.
Moving Averages Crossing Strategy
The moving averages crossing strategy involves the use of two moving averages, typically a shorter-term one and a longer-term one. When the shorter-term moving average crosses above the longer-term moving average, it generates a bullish signal. Conversely, when the shorter-term moving average crosses below the longer-term moving average, it generates a bearish signal.
Benefits of Moving Averages Crossing Strategy
The moving averages crossing strategy helps traders identify potential trends and reversals in the market. It can be used in different timeframes, from short-term to long-term, depending on the trader's objectives. This strategy is relatively simple to understand and implement, making it suitable for beginner traders.
Limitations of Moving Averages Crossing Strategy
While the moving averages crossing strategy is a popular technique, it has its limitations. It may generate false signals during periods of low volatility or in sideways markets. Traders should use additional indicators or confirmatory signals to reduce the risk of false signals and improve the accuracy of their trades.
Moving Averages in Trading: Enhancing Trend Analysis and Decision-Making
Moving averages are fundamental tools in the arsenal of traders, providing valuable insights into market trends and aiding in informed decision-making. Whether you are a novice or an experienced trader, understanding the significance of moving averages can elevate your trading strategies.
")
What Are Moving Averages?
Moving averages are statistical calculations used to analyze data points across a specified time period, creating a smoothed line that helps identify trends over time. In trading, the two most common types are Simple Moving Averages (SMA) and Exponential Moving Averages (EMA).
Simple Moving Averages (SMA):
SMA is calculated by adding up a set of closing prices over a defined period and then dividing by the number of periods. For example, a 50-day SMA considers the closing prices of the last 50 days, providing a snapshot of the average price over that period.
Exponential Moving Averages (EMA):
EMA, on the other hand, gives more weight to recent prices, making it more responsive to short-term price movements. Traders often use EMAs for more timely insights into market changes.
How Moving Averages Work:
Trend Identification:
- Moving averages help traders identify the direction of the prevailing trend. If the price is consistently above the moving average, it suggests an uptrend, and if below, a downtrend.
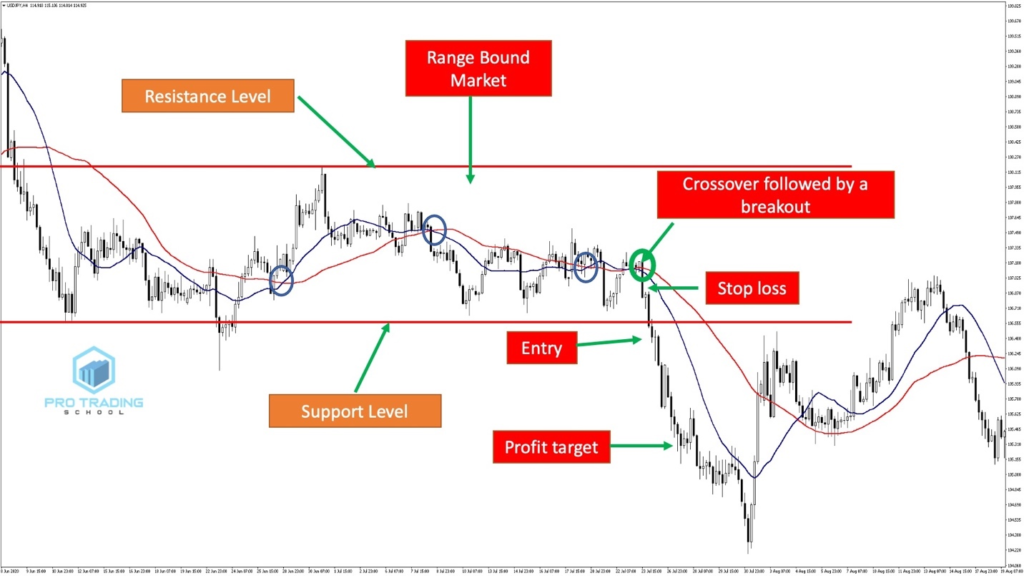
Support and Resistance Levels:
- Moving averages act as dynamic support and resistance levels. Prices often bounce off moving averages, indicating potential reversal points.
Crossovers:
- The intersection of different moving averages, such as the golden cross (short-term crossing above long-term) and death cross (short-term crossing below long-term), signal potential changes in trend direction.
Common Moving Average Timeframes:
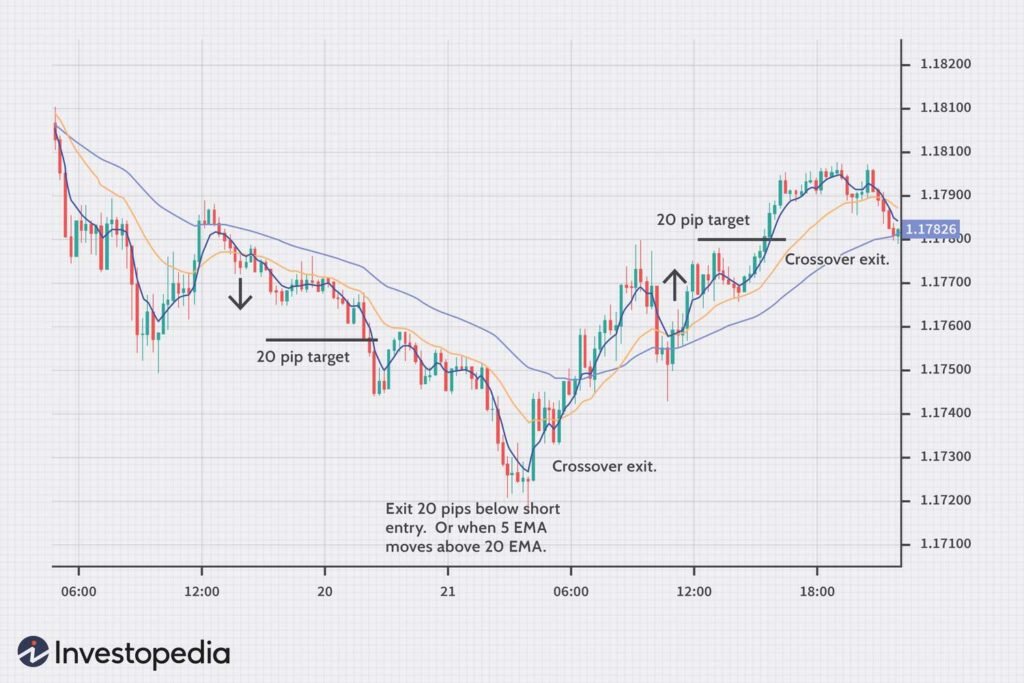
Short-Term (5 to 20 days):
- Provides insights into short-term price movements.
Intermediate-Term (50 to 100 days):
- Offers a broader perspective, smoothing out short-term fluctuations.
Long-Term (200 days and above):
- Used for identifying major trends, especially in longer investment horizons.
Application in Trading Strategies:
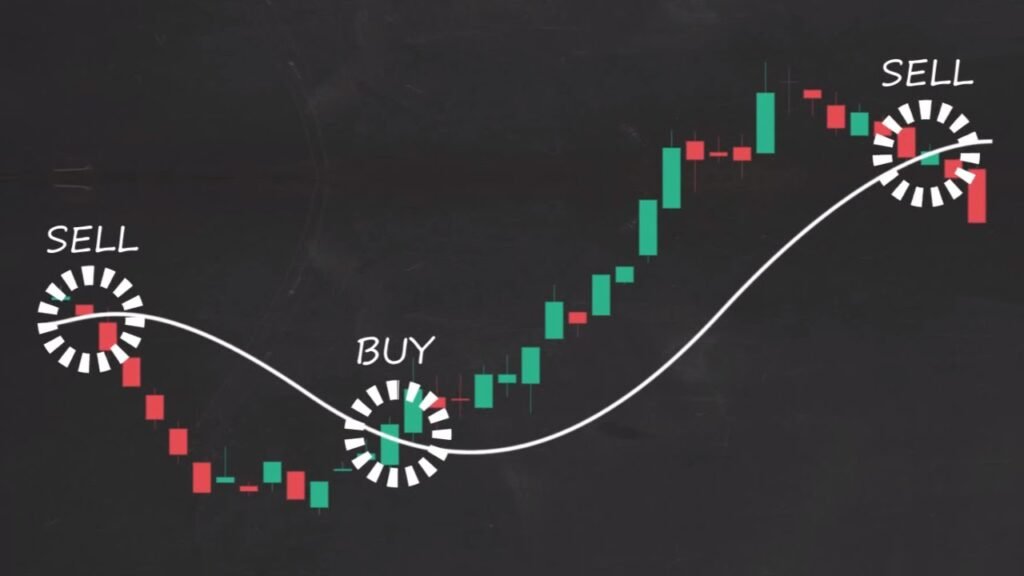
Moving Average Crossovers:
- Traders often buy when short-term averages cross above long-term averages and sell when the opposite occurs.
Trend Confirmation:
- Moving averages confirm the strength and sustainability of a trend.
Support and Resistance Trading:
- Identify potential reversal points by observing how prices interact with moving averages.
Divergence Analysis:
- Evaluate divergence between price and moving averages for potential trend reversals.
Potential Pitfalls:
Lagging Indicator:
- Moving averages are based on historical data, making them lagging indicators that may not capture rapid market changes.
Whipsaw Effect:
- In choppy or sideways markets, moving averages may generate false signals, resulting in unprofitable trades.
Conclusion
The crossing of moving averages is a basic yet effective strategy used by traders in the financial markets. It helps identify potential trends and entry or exit points. Traders should consider using this strategy in conjunction with other technical analysis tools to increase the probability of successful trades. Remember, practice and continuous learning are essential for mastering any trading strategy.
Leave a Reply